|
<< Click to Display Table of Contents >> Charts |
  
|
|
<< Click to Display Table of Contents >> Charts |
  
|

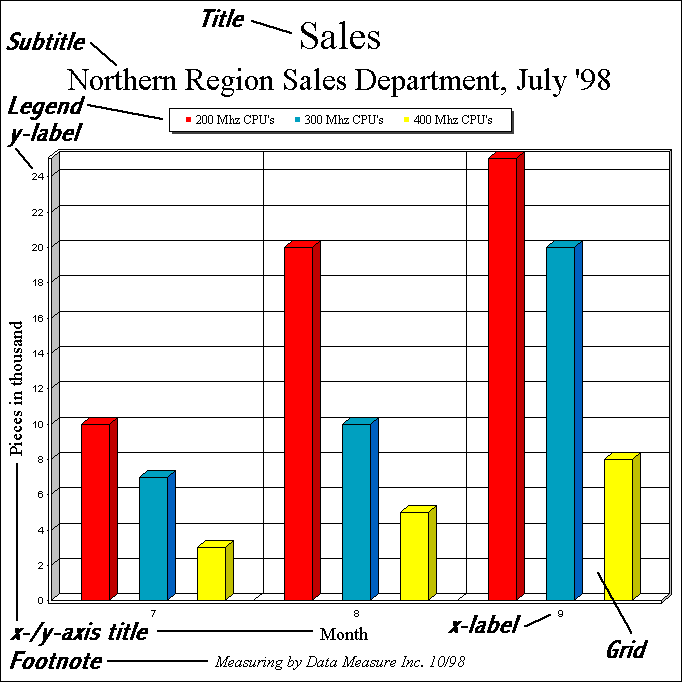
The chart was created with the following short code sequence:
VCL:
hData: Pointer
hData = Doc.ChartDataCreate(3, 3) // 3 Rows and 3 Columns
Doc.ChartTitle = "Sales"
Doc.ChartSubTitle = "Northern Region Sales Department, July '98"
Doc.ChartFootNote = "Measuring by Data Measure Inc. 10/98"
Doc.ChartLegendPosition = VCHART_LEGENDPOS_TOP
Doc.ChartDataSetXAxisTitle(hData, "Month")
Doc.ChartDataSetYAxisTitle(hData, "Pieces in thousand")
Doc.ChartDataAddLegend(hData, "200 Mhz CPU's")
Doc.ChartDataAddLegend(hData, "300 Mhz CPU's")
Doc.ChartDataAddLegend(hData, "400 Mhz CPU's")
Doc.ChartDataAddValue(hData, 0, 10) // Row 0
Doc.ChartDataAddValue(hData, 0, 20)
Doc.ChartDataAddValue(hData, 0, 25)
Doc.ChartDataAddValue(hData, 1, 7) // Row 1
Doc.ChartDataAddValue(hData, 1, 10)
Doc.ChartDataAddValue(hData, 1, 20)
Doc.ChartDataAddValue(hData, 2, 3) // Row 2
Doc.ChartDataAddValue(hData, 2, 5)
Doc.ChartDataAddValue(hData, 2, 8)
Doc.ChartXLabelStartValue = 7
Doc.Chart(1, 1, -18, -18, hData, VCHART_3D_BAR)
All other component types (ActiveX, .NET, Java, …):
Dim Data as TVPEChartData
Data = Doc.ChartDataCreate(3, 3) // 3 Rows and 3 Columns
Doc.ChartTitle = "Sales"
Doc.ChartSubTitle = "Northern Region Sales Department, July '98"
Doc.ChartFootNote = "Measuring by Data Measure Inc. 10/98"
Doc.ChartLegendPosition = ChartLegendPosition.Top
Data.XAxisTitle = "Month"
Data.YAxisTitle = "Pieces in thousand"
Data.AddLegend("200 Mhz CPU's")
Data.AddLegend("300 Mhz CPU's")
Data.AddLegend("400 Mhz CPU's")
Data.AddValue(0, 10) // Row 0
Data.AddValue(0, 20)
Data.AddValue(0, 25)
Data.AddValue(1, 7) // Row 1
Data.AddValue(1, 10)
Data.AddValue(1, 20)
Data.AddValue(2, 3) // Row 2
Data.AddValue(2, 5)
Data.AddValue(2, 8)
Doc.ChartXLabelStartValue = 7
Doc.Chart(1, 1, -18, -18, Data, ChartType.Bar3D)